How to boost Core Web Vitals
![]() by Tim Bednar updated March 29, 2023 with bug fixes
by Tim Bednar updated March 29, 2023 with bug fixes

What's in the Waterfaller toolset:
- Custom webpage performance analysis
- Guidebook to boosting Core Web Vitals
- Assistance to implement remedies effectively
Tweet by Cyrus Shepard “If you need help fixing/understanding Core Web Vitals,
waterfaller.dev is one of the absolute best (+ free)”

Attention: web professionals and cross-functional teams
You don't have to be an performance expert to benefit from Waterfaller. SEO consultants, site owners, and project managers use it with their teams to improve Page Experience.

Improve the impact of your fixes
Many struggle when a "recommended" Core Web Vital changes make no improvements. This toolset is writes testable tasks using a proven agile methodology.

Use the online assistant to step you through the guidebook
The step-by-step assistant will help you understand and implement each fix using the same agile methodology valued by many teams.
 Who is Tim Bednar?
I am a web developer living in Stillwater, MN who has worked on web performance optimization for 15 years. During that time, I've bulletproofed an e-commerce platform for Black Friday, boosted Core Web Vitals on a WordPress platform hosting over 8,000 sites, and leveled up the page experience for a multi-language B2B marketing site. I created Waterfaller as a toolset for optimizing webpage performance using agile methodologies. Tweet at me with your feedback or questions.
Boost Core Web Vitals in three steps
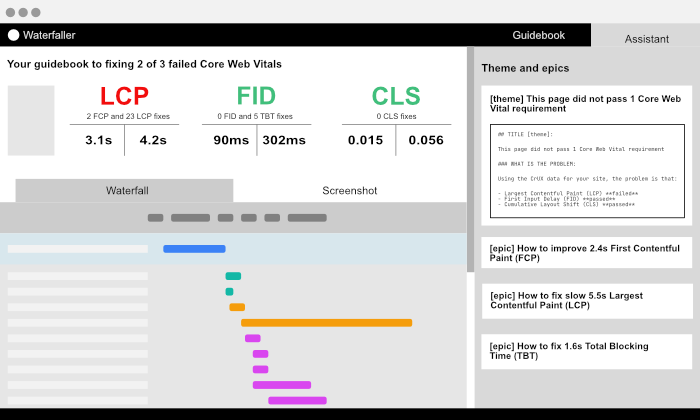
Use Waterfaller to analyze a mobile or desktop web page for issues that could harm Core Web Vitals. The algorithm will analyze each file loaded by your page for speed, size, sequence, and context to create a custom guidebook.
Review your guidebook using the online assistant. Using the interactive waterfall, we'll explain how your page performs, pinpoint issues, outline acceptance criterial, and provide a range of technical solutions.
Copy the guidebook's epics, themes, and stories with the help of the online assistant into any sprint planning software. With our guidebook and assistant, you can confidently collaborate in your next sprint planning meeting.
Optimizing web performance is central to Core Web Vitals
Origins of web performance optimization
Performance refers to how fast a web page loads, renders, and is ready for visitors. In 2004, Steve Souders defined web performance optimization as the practice of maximizing the speed at which web pages are downloaded and displayed in a web browser.
A brief history of performance metrics
At the start of the world wide web, pages used data from server logs and optimized to increase server performance. As browsers and servers became more sophisticated, we started monitoring the timing of browser events such as time-to-first-byte, page load, DOM content loaded, and fully loaded.
Soon it became clear that these metrics needed to be user-centric (rather than browser events) to support modern web development. In 2012, Speed Index was introduced to measure how fast a page visually appeared to the user. Quickly other user-centric metrics were created such as SpeedPerception and Above the Fold Time. Then in 2020, Google started using Core Web Vital metrics for page rank.
Core Web Vitals measure three aspects of user experience
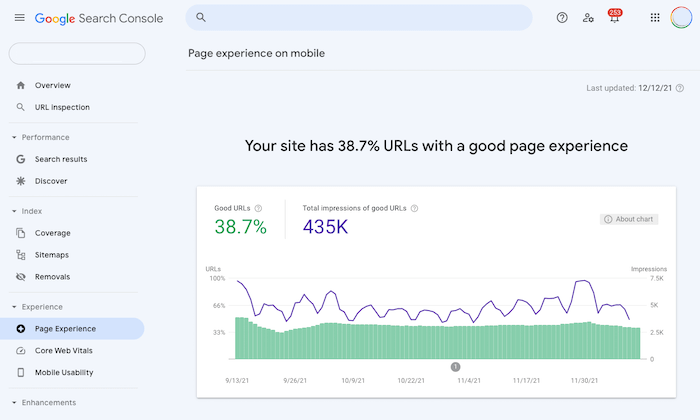
The Core Web Vitals are a set of performance signals used by Google Search to assess the quality of the user experience. The metrics for 2021-22 evaluate three aspects of the user experience - loading, interaction, and visual stability. Google uses its Chrome web browser to collect these metrics from users. These metrics are reported by the Google Search Console at a high level in the Page Experience section and in more detail in the Core Web Vital report. A page must pass all three metric requirements to earn a "good" rating.
WPO Resources
High-Performance Web Sites: Essential Knowledge for Front-end Engineers by Steve Souders
Web Performance Optimization by Steve Souders
User-centric performance metrics by Philip Walton
Best Practices for Speeding Up Your Web Site by Yahoo Yslow
Evaluating Page Experience by Google Search Central Blog
Core Web Vitals by Web.dev
Chrome User Report documentation
Each Core Web Vitals metric measures user experience
Largest Contentful Paint measures loading time
The Largest Contentful Paint (LCP) measures how fast a page displays the largest component visible to a user (most often an image or text block). The rationale behind this metric is that a page with a faster load time will result in higher engagement and conversions.
LCP takes place after time-to-first-byte (TTFB) and first contentful paint. (FCP). TTFB measures the time that the first content is received from the server while FCP is the first time a user can see anything on the screen.
First Input Delay reveals how responsive a page feels
The First Input Delay (FID) measures the responsiveness of a page when a user interacts with it for the first time. FID can be hard to understand because this metric can only be measured in the field as it requires user interaction. So it can not be measured directly by tools like Waterfaller or even PageSpeed Insights. Rick Viscomi explains it like this, "It’s like measuring the time from ringing someone’s doorbell to them answering the door." The good news is that most web pages do not fail the first input delay requirement. The logic here is that users will abandon a page if it does not respond as expected.
How is First Input Delay related to Total Blocking Time?
If you are familiar with testing Core Web Vitals using tools like PageSpeed Insights or Waterfaller, you will see Total Blocking Time (TBT) paired with FID. TBT measures responsiveness without needing direct user input measuring the total time the browser is unresponsive. It is common for a page to fail TBT but pass FID.
FID is also related to time-to-interactive. TTI measures the first time that a page is interactive for at least five seconds after First Contentful Paint (FCP). The lab measure indicates when a user can reliably use the page and while not a Core Web Vital, it is often an excellent business measure.
Cumulative Layout Shift identifies visual stability
Cumulative Layout Shift (CLS) measures how much and often a user sees components like buttons and ads shift around on a page. Users trust pages that appear and function as they expect. These unpredictable shifts in the layout are frustrating for users and lead to page abandonment.
Accelerate webpage performance for profit
Pages with good LCP, FID, and CLS scores rank higher
The Google Search algorithm has evolved to be more user-centric. It rewards sites that perform well in terms of loading time, first input delay, and visual stability as measured by the Core Web Vitals. Preliminary research shows that domains that meet all their requirements rank increasingly higher in Google search results. Many sites also report improved clicks and impressions after improving loading speeds, responsiveness, and layout stability.
Web performance gains predictably improve business
The purpose of improving webpage performance is not just to increase organic search traffic. All web performance optimizations should ultimately improve user engagement and boost conversions. Google reports that pages that meet Core Web Vital thresholds experience 22% less abandonment for news sites and 24% less abandonment for shopping sites. Compared to many other marketing initiatives available to site owners, webpage performance is a data-driven and low-risk investment.
Business resources
Core Web Vitals is a Measurable Ranking Factor by Sistrix
Core Web Vitals initial impact by SEMRush
The science behind Core Web Vitals
Defining Core Web Vital Threshholds
WPO Stats by Tammy Everts and Tim Kadlec
Avoid common mistakes when using web performance data
Use lab data to explain data collected from real users
It is crucial to use field (or real user data) and laboratory (or synthetic) data correctly because both are consequential, yet the two are very different. Lab data simulates a visit to a page using a single, pre-configured device, location, and internet connection. It is best used for regression tests and diagnostics.
Field data is gathered from visitors' real page loads and varies based on device, location, and connection. It is also called Real User Monitoring (RUM). This data is usually collected by site owners for their business, but in 2017, Google started collecting data from real users and published it as the Chrome User Experience Report (CrUX).
CrUX data is used by Google in the Search Console Core Web Vitals report and as one of the signals for page rank. There are two types of evaluations that Google makes: one that considers all the pages on your domain and an individual score for those pages with enough traffic.
This field data is the best source of truth when evaluating web performance for your site. Over-reliance on lab data can lead to blind spots that only field data can reveal. Tools like Waterfaller or PageSpeed Insights use "synthetic" or "lab" testing to analyze pages. And while these tests attempt to replicate "real" users, these tests do not reveal actual experiences. It is recommended to use field data to identify slowdowns, and lab data to diagnose and resolve them.
Focus on the 75th percentile for the most predictable findings
While most professionals are accustomed to using averages or medians, Core Web Vital requirements focus on the 75th percentile. This means that 3 of 4 visitors must meet the LCP, FID, and CLS standards. So, most visitors are guaranteed a good experience while not overburdening the site by optimizing for slow internet speeds and old devices.
Seven official ways to measure Core Web Vitals
Google currently provides seven ways to monitor these metrics: Search Console (field), PageSpeed Insights (lab and field), Lighthouse (lab), Chrome DevTools (lab), Chrome UX Report (field), Web Vitals Extension (lab), and the Web Vitals JavaScript library (field). There also are dozens of vendors offering digital experience monitoring (DEM) which tracks availability, load time, and experience of a webpage visitor. These can provide valuable dashboards and tools to stay on top of web performance.
Waterfaller is not a DEM rather it is a complete toolset that uses real-time lab test information with available CrUX field data to prepare a guidebook to fix Core Web Vitals. Once you identify the problem using the Search Console, analyze the page URL using this toolset and get a step-by-step agile action plan.
Monitoring websites is very important. What is the best way to do it?
Your web pages change more often than you think. Each code release and content update results in a new HTML source file which then loads new images, media, stylesheets, fonts, and JavaScript. Most web pages load 70 or more files for every pageview. If you use a tag manager, third-party scripts can be added resulting in dramatic changes.
This means that continuous monitoring is critical to maintaining gains in web performance. Studies indicate that page speed can regress within six months if not monitored.
It is recommended to review Core Web Vitals monthly resulting in new stories added to the web development backlog. Waterfaller can provide web professionals the ability to collaborate with developers with confidence. Our algorithm writes stories that can help you ship code.
Data resources
The science behind Core Web Vitals
Defining Core Web Vital Thresholds
Response Times: Three important limits by Jakob Nielsen
Guarantee that 100% of all your URLs offer a good page experience
Take an agile approach to fixing Core Web Vitals
Most web development shops have adopted an agile methodology to deliver websites and applications. Agile takes complex problems and breaks them down into manageable chunks to release incremental changes. This approach allows teams to get smaller wins while advancing toward the larger goal. It is the ideal approach to fixing Core Web Vitals.
Clearly state what results you expect in your theme
The theme is a grouping of smaller epics that together drive towards a common goal. In this scenario, the theme delineates the Core Web Vitals problem and identifies the epics required to achieve a “Good” Page Experience rating in Google Search Console. To accurately assess a page, compare a real-time audit against the 28-day rolling aggregate score recorded in the Chrome User Experience Report (CrUX). The comparison determines if your page passed, failed, regressed, or needs to be validated. The theme summarizes the actual situation and the expected result.
Themes are broken down into manageable tasks by epics
Core Web Vitals is too large a problem to be tackled (counter to what some claim). The epic is a collection of user stories that roll up to the broader theme. Using epics, you can identify smaller goals to improve LCP, FID, and CLS. The result is a helpful hierarchy of work.
Deliver predictable results writing testable user stories
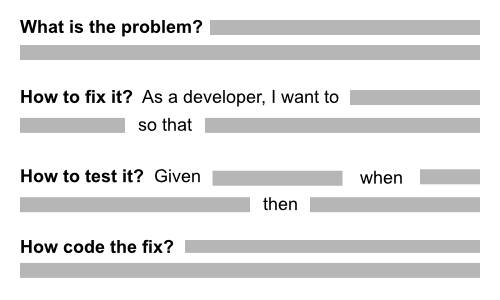
A story (sometimes called a task or issue or ticket) is the smallest unit of work in agile. In this framework, stories roll up to epics which then roll up to the broader theme. For webpage performance, stories must focus on predictable improvements. The stories are added to backlogs, planned in meetings, and worked on during two-week sprints. Epis are completed when all stories are done.
Webpage performance is a feature, not technical debt
Some would argue that Core Web Vital problems are technical debt. This may be truer for some CMS and e-commerce platforms, but the best organizations start to think of web page loading, interaction, and visual stability as features. Organizations with limited resources can outperform the competition by simply paying attention to LCP, FID, and CLS.
Plan LCP, FID, and CLS improvements and level up your career
While improving CVW is not easy, boosting Largest Contentful Paint, First Input Delay, and Cumulative Layout Shift can be planned. Use an agile approach, write good themes, epics, and stories, and plan a two-week sprint. If you do it right, you will know exactly what to expect when you are done. Communicate these expectations to your stakeholders, and you will level up your career.
Agile resources
Performance by the HTTP Archive 2021 Almanac
Response Times: Three important limits by Jakob Nielsen
The Best solutions that optimize web performance
Diagnose failing webpages using the browser waterfall
Mobile and desktop browsers work the same way. They load an HTML file from a URL, parse the source code, load additional files (like stylesheets, scripts, and images), and then render a webpage. A waterfall chart visualizes this process showing when and how each file loads. Waterfaller analyzes this data looking for "antipatterns" that negatively impact Core Web Vitals. Each file is examined for context, size, type, and contribution to the page experience. A user story is written to precisely target problematic files which can then be fixed. The waterfall underlies Waterfaller's interface as well as its algorithm.
Using PageSpeed Insights to write agile user stories
Online applications such as PageSpeed Insights use an open-source tool called Lighthouse to run audits that improve web pages. The Waterfaller algorithm leverages this information but adds experience-based opinion to deliver an action plan tailored for your situation. The result is a guidebook that leads teams through an agile approach to correcting performance issues. This enables collaboration between non-technical professionals and development teams.
Set a budget for improving web performance
The best way to start boosting Core Web Vitals is to inventory every file loaded by your web page and compare it to a budget. This is done by analyzing the browser's waterfall and counting each file type (images, stylesheets, fonts, and scripts). The budget employed by Waterfaller is created by reverse engineering pages that pass Core Web Vitals to establish a profile of a successful page. The rationale is that any comparable page will also pass all three Core Web Vital metrics. This budgetary evaluation drives suggested technical solutions.
How to fix LCP: About 45% of desktop and 60% of mobile pages fail Largest Contentful Paint
There are page-level fixes that can improve LCP...
- Time-to-first-byte (TTFB) times ought to be under 1500ms.
- Load all stylesheets before the script files. This eliminates blocking file downloads by the browser.
- Limit the number of render-blocking stylesheets or scripts which can be fixed by asynchronous loading or more efficient code.
- Make files as small and fast as possible.
- Eliminate 404 responses.
- Prevent redirects.
- Reduce the number of files loaded before LCP. This can be achieved by deferring scripts, reducing inefficient fonts, or correctly lazy loading images to meet this recommendation.
- Preload the LCP image.
- Self-host third-party fonts.
Waterfaller writes 13 different kinds of user stories available for free in a free guidebook tailored to any webpage.
How to fix FID: Almost all desktop pages and 90% of mobile pages pass First Input Delay
However, 7 in 10 mobile pages fail Total Blocking Time the lab proxy metric for First Input Delay. Interactive blocks are caused by inefficient scripts that are too large, contain unused or legacy code, or execute long tasks. The best action plan is to evaluate every third-party tag or script and remove those that do not add value. Waterfaller is tuned to identify both first and third-party scripts that cause slowdowns and lists solutions for developers.
How to fix CLS: Almost 1 in 4 desktop and mobile pages fail Cumulative Layout Shift
The most common causes of poor CLS include not adding a height or width to images, line wrapping when custom fonts load late, inserting ads or banners after the page starts rendering, and popping up cookie compliance messages. Charts do a poor job of identifying these UX antipatterns, so Waterfaller identifies shifts directly on a full-size screenshot.